
Occupancy Rate Formula: How to Calculate It
Calculating your hotel's occupancy rate is straightforward with this simple formula:
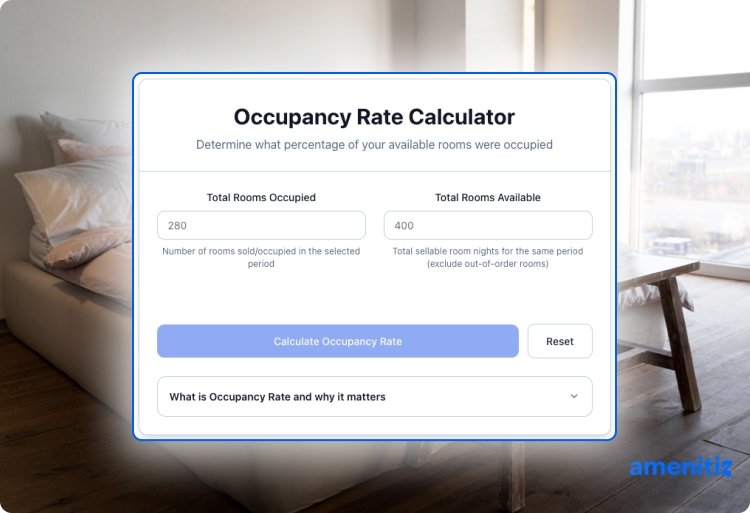
Occupancy Rate = (Number of Rooms Occupied ÷ Total Available Rooms) × 100
Example Calculation:
If your 20-room hotel sold 15 rooms last night:
- Rooms Occupied: 15
- Total Available Rooms: 20
- Occupancy Rate: (15 ÷ 20) × 100 = 75%
Accounting for Out-of-Service Rooms:
If 2 rooms are undergoing maintenance:
- Available Rooms: 20 - 2 = 18
- Rooms Occupied: 15
- Occupancy Rate: (15 ÷ 18) × 100 = 83.3%
Pro Tip: Calculate occupancy rate daily, weekly, and monthly to identify trends and make data-driven pricing decisions. Track seasonal variations to optimize your revenue management strategy throughout the year.
Average Occupancy Rates in the Hotel Industry
Understanding industry benchmarks helps you evaluate your property's performance. Occupancy rates vary significantly by region, property type, and season.
Global Occupancy Rate Benchmarks (2024-2025):
- Europe: 78% average annual occupancy
- North America: 66% average annual occupancy
- Asia-Pacific: 64% average annual occupancy
- Middle East & Africa: 67% average annual occupancy
- South America: 56% average annual occupancy
By Property Type:
- Luxury Hotels: 70-75% average occupancy
- Upscale/Mid-scale Hotels: 65-72% average occupancy
- Economy Hotels: 62-68% average occupancy
- Boutique Hotels: 60-70% average occupancy
- Bed & Breakfasts: 55-65% average occupancy
Important Context: A 60% occupancy rate can signal strong performance if your local market averages 40%—or indicate weakness if competitors average 80%. Always benchmark against your competitive set and historical performance rather than global averages alone.
Why Occupancy Rate is Critical for Independent Hoteliers
For small hotel owners and B&B operators, occupancy rate serves as a strategic compass guiding critical business decisions:
1. Revenue Management and Pricing Strategy
High occupancy with low Average Daily Rate (ADR) may indicate you're underpricing. Conversely, low occupancy with high ADR suggests you're pricing yourself out of the market. Occupancy rate helps you find the optimal balance.
2. Operational Efficiency
Understanding occupancy patterns helps you:
- Schedule staff appropriately
- Manage inventory and supplies
- Plan maintenance during low-occupancy periods
- Optimize housekeeping and front desk operations
3. Marketing Effectiveness
Track occupancy before and after marketing campaigns to measure ROI. If a new OTA listing or direct booking campaign increases occupancy, you can quantify its success.
4. Financial Planning and Forecasting
Historical occupancy data enables accurate revenue projections for budgeting, loan applications, and strategic planning. Lenders and investors closely examine occupancy trends when evaluating property performance.
5. Competitive Analysis
Compare your occupancy against the competitive set (hotels in your immediate market with similar characteristics). This reveals market share and identifies opportunities for improvement.
5 Proven Strategies to Improve Your Hotel Occupancy Rate
1. Implement Dynamic Pricing
Adjust room rates based on demand, seasonality, local events, and competitor pricing. Dynamic pricing tools like Amenitiz PriceAdvisor automatically optimize rates to maximize both occupancy and revenue.
Practical Application:
- Increase rates during high-demand weekends, festivals, or conferences
- Lower rates strategically during shoulder seasons to maintain occupancy
- Create urgency with time-limited promotions during slow periods
2. Optimize Your Distribution Strategy
Expand your visibility across multiple channels while maintaining rate parity:
- Direct Bookings: Use a high-converting booking engine on your website to capture commission-free reservations
- OTA Presence: List on 120+ online travel agencies through a channel manager like Amenitiz to reach global travelers
- Metasearch Engines: Appear on Google Hotel Search, Tripadvisor, and Kayak
- Local Partnerships: Collaborate with tourism boards, event organizers, and local businesses
Channel Mix Strategy: Aim for 30-40% direct bookings and 60-70% OTA bookings to balance commission costs with visibility.
3. Apply Strategic Length-of-Stay Restrictions
During peak demand periods (local events, holidays, peak season), implement minimum length-of-stay requirements:
- 2-night minimum for festival weekends captures Thursday/Friday arrivals
- 3-night minimum for holiday periods fills shoulder nights
- Weekly rates during summer maximize high-season occupancy
This strategy increases total revenue per guest and reduces operational costs from frequent turnovers.
4. Create Targeted Packages and Promotions
Design value-added packages that appeal to specific guest segments:
- Romance Package: Champagne, late check-out, room upgrade
- Business Traveler Package: Flexible cancellation, breakfast, workspace amenities
- Family Package: Connecting rooms, local attraction tickets, kid-friendly amenities
- Extended Stay Discounts: 7+ night stays at reduced nightly rates
Last-Minute Deals: Offer flash sales 48-72 hours before arrival to fill unsold inventory without degrading future demand.
5. Enhance Your Online Reputation
Properties with ratings above 4.5 stars see 26% higher occupancy than those below 4.0 stars.
Reputation Management Tactics:
- Respond to all reviews within 24-48 hours
- Encourage satisfied guests to leave reviews via post-stay emails
- Address negative feedback constructively and publicly
- Showcase positive reviews on your website and social media
- Monitor review sentiment across all platforms
Pro Tip: Use Amenitiz's integrated tools to automate review requests and manage your online reputation from a single dashboard.
Occupancy Rate vs. Other Essential Hotel KPIs
Occupancy rate provides valuable insights, but combining it with complementary metrics delivers a complete performance picture.
Occupancy Rate vs. ADR (Average Daily Rate)
ADR measures average revenue per occupied room (Total Room Revenue ÷ Rooms Sold).
The Relationship:
- High occupancy + Low ADR = Rooms filled at discounted rates (potential revenue loss)
- Low occupancy + High ADR = Premium pricing driving away guests (lost revenue opportunity)
- High occupancy + High ADR = Optimal performance (maximize both metrics)
Balanced Approach: Use our ADR Calculator alongside occupancy tracking to ensure you're not sacrificing rate for volume.
Occupancy Rate vs. RevPAR (Revenue per Available Room)
RevPAR combines occupancy and ADR into one powerful metric:
RevPAR = ADR × Occupancy Rate
Example:
- ADR: €120
- Occupancy: 75%
- RevPAR: €120 × 0.75 = €90
RevPAR reveals true revenue performance because it accounts for unsold rooms. Calculate your RevPAR with our RevPAR Calculator.
Key Insight:
You can achieve the same RevPAR with different strategies:
- Strategy A: 80% occupancy × €100 ADR = €80 RevPAR
- Strategy B: 60% occupancy × €133 ADR = €80 RevPAR
Strategy B delivers the same revenue with fewer operational costs (housekeeping, breakfast, utilities), potentially yielding higher profitability.
Common Occupancy Rate Mistakes Independent Hoteliers Make
1. Chasing 100% Occupancy at Any Cost
High occupancy doesn't guarantee profitability. Heavily discounting to reach full occupancy often reduces overall revenue and degrades brand perception.
Solution: Target optimal occupancy (65-85%) at rates that maximize total revenue.
2. Ignoring Seasonal Patterns
Expecting consistent year-round occupancy leads to poor planning and lost revenue opportunities.
Solution: Analyze 2-3 years of occupancy data to identify seasonal trends. Develop distinct pricing strategies for high, shoulder, and low seasons.
3. Measuring Only Weekly or Monthly Occupancy
Missing day-of-week patterns prevents effective pricing optimization.
Solution: Track occupancy by day of week. Adjust rates for high-demand days (typically Fridays/Saturdays) versus low-demand periods (Sundays/Mondays).
4. Not Benchmarking Against Competitors
Evaluating occupancy in isolation provides incomplete insights.
Solution: Research your competitive set's occupancy through STR reports, local tourism data, or industry connections. Calculate your Market Penetration Index (MPI).
5. Overlooking Out-of-Service Rooms
Including maintenance rooms in calculations distorts true occupancy performance.
Solution: Calculate two occupancy metrics—total available rooms and sellable rooms—to accurately measure performance.
How Amenitiz Helps You Optimize Occupancy and Revenue
Managing occupancy effectively requires the right technology. Amenitiz provides independent hoteliers with an all-in-one platform to track, analyze, and optimize performance:
Real-Time Occupancy Tracking
Monitor current and future occupancy from your PMS dashboard. Identify trends instantly and adjust strategies accordingly.
Dynamic Pricing with PriceAdvisor
Automatically optimize room rates based on occupancy forecasts, competitor pricing, and local demand. Clients see 20-40% revenue increases.
Multi-Channel Distribution
Sync inventory and rates across 120+ OTAs with our Channel Manager. Prevent overbookings while maximizing visibility.
Commission-Free Direct Bookings
Drive reservations through your branded Booking Engine, keeping 100% of revenue without OTA commissions.
Performance Analytics
Track occupancy rate, ADR, RevPAR, and other KPIs in one centralized dashboard. Make data-driven decisions that boost profitability.
Ready to maximize your hotel's occupancy and revenue? Book a free demo to see how Amenitiz simplifies property management for 15,000+ independent hoteliers worldwide.


